5 digital marketing metrics every Fintech company should measure

Fintech companies, arguably more than most, are incredibly data-driven. Continuously monitoring key web analytics is vital not only for customer experience but for making sure business goals are being met.
Looking beyond the abundance of vanity metrics and lengthy reports allows Fintech marketing teams to focus on the core KPIs that will help drive decisions on digital marketing strategy.
CPA (COST PER ACQUISITION)
This takes a more simplistic marketing performance KPI like Cost Per Lead (CPL) to the next level and allows your business to evaluate the true cost of acquiring new customers.
However, it’s not always easy, so many Fintech businesses stop short at CPL and then try to gauge what ‘feels’ like the right level of leads they need to be generating from their digital marketing.
To effectively measure CPA, you need to be able to track from source right through to closing the sale, which for many businesses can prove a challenge and the right tools are needed to track enquiries generated from multiple marketing activities, alongside how much revenue was generated as a result.
This is where marketing and sales alignment is critical. Connecting marketing data with CRM sales data is essential for demonstrating the value of digital marketing activity in any lead-based or product-led Fintech business.
Ideally, the equation should include all marketing costs as well as sales and support resource costs needed to bring a new customer on board, along with any associated product or technical costs.
LIFETIME CUSTOMER VALUE
Knowing the Lifetime Customer Value (LCV) of an average client is a better indicator of how profitable a prospect might be than just looking at the first sale in isolation.
LCV is a prediction of the total value of a customer in terms of either revenue or net profit. Understanding LCV may help drive decisions around marketing spend and how much you’re prepared to pay to acquire a new customer.
The following pieces of information are needed to calculate LCV:
Average customer value
Average repeat purchase rate
Average number of years you keep a customer / retention rate
In this example, if a client pays a monthly subscription fee to an online platform of £59 per month and you have a 12 month initial agreement, your minimum LCV would be £708.
If past experience (or research, for Fintech start-ups) shows that clients typically renew their contracts for 2.5 years, you can use this estimated total to get a LCV of £1,770.
Next, include a retention rate in your calculation. For instance, how many clients left before 2.5 years? Find the percentage of clients who left earlier than your average. This is your shrinkage factor.
If your shrinkage factor is 20%, your retention rate is 80%. Multiply 0.8 by 30 months to get 24 months of service. Your LCV is now £1,416.
Once calculated, you can feed this figure into any customer retention projects and re-evaluate LCV to track success.

CONVERSIONS FROM ALL TOUCH POINTS
Before fairly assessing the success of any digital marketing activity, it’s important to check that conversion metrics are being tracked across all available touch points on the website and any associated landing pages.
Do you have click-to-call tracking on all instances of the phone number?
Are all form completions tracked, including any pop-ups?
Are campaign landing pages linked to to your analytics platform?
Google Analytics goal tracking can be used to track multiple conversion points:
Contact form completions
Registrations
Trial signups
Newsletter sign ups
Whitepaper downloads
However not all conversions were created equal. A trial signup is clearly more valuable than a newsletter signup.
By assigning a nominal goal value you can build a picture of where your high-value leads are coming from and discover which of your marketing activities are driving the most, and the best, leads.
PERCENTAGE OF MOBILE VISITS
Traffic from mobile devices is still on the rise. Shifting ahead of desktop usage, traffic from mobile makes up over half of all website visits, increasing a further 2% year-on-year between 2017 and 2018.
Consumers now have far more confidence in making online payments via mobile devices. In Europe alone, the number of mobile payment users rose from 5.5m in 2009 to 64m in 2016, an increase of 1063%.
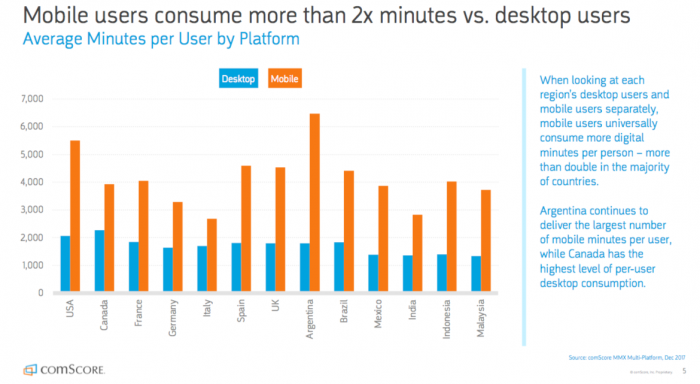
Mobile users are also spending longer viewing mobile media than desktop users
With such strong mobile device usage figures, Fintech companies should adopt a mobile-first marketing strategy. By understanding how mobile visitors behave differently to desktop users the mobile user experience can be optimised to increase landing page conversion rates and ultimately leads.
Some points to consider when reviewing the mobile user experience might be:
Is the site fully optimised to be user-friendly across all mobile devices?
Do we build a mobile-first website or opt for a responsive design?
Are landing pages optimised for the mobile user experience?
Would an app provide more value than a mobile site?
Are interaction points effortless on mobile? E.g. form fills, online support, sales chat, click-to-call, etc.
For larger existing Fintech companies, effecting rapid change on their online platforms may be tricky so creating mobile-specific landing pages might be a good option, whereas Fintech start-ups can consider the mobile user experience from the outset.
ORGANIC SEARCH TRAFFIC
This is a key metric to monitor and focus effort on growing, not just for Fintech companies, but for all businesses who want to generate leads online.
By consistently growing organic traffic you will not only see a corresponding increase in leads and sales, you are likely be obtaining these customers at a lower cost.
Once your site is ranking well for search phrases your target audience are using you will undoubtedly reap the benefits for as long as those keywords rank.
Unlike many other digital marketing channels, you are not paying per impression or per click.
Once a keyword is delivering traffic to your site, you will not pay for each visit individually so the investment in resource for organic search is front loaded (although a commitment to ongoing content development is needed to continue to improve results) and the more visits you can deliver from organic the better the ROI.
Economies of scale for digital marketing!
Organic traffic converts on average at 15% for the Technology sector (hardware, software, IT). Compare that with PPC conversion rates of 2.92% for the sector and it’s clear to see why organic search is worth the investment.
LANDING PAGE CONVERSION RATES
Once you’re driving traffic to your site (especially as you’re likely to be paying for a large proportion of it) you’ll want to ensure your landing pages are delivering the maximum number of leads and avoid a high percentage of visitors bouncing off the page.
It’s unlikely that your homepage alone will have a high conversion rate and it’s very often a necessity to build dedicated landing pages to serve digital marketing traffic.
Landing pages that are optimised for data capture convert at 2.23% on average. Add a lead magnet like a free guide in to the mix and we typically see conversion rates increase to anywhere between 5% and 15%.
To look at this in terms of visitor numbers:
500 visits to an optimised landing page with a clear call-to-action and data capture form will generate around 11 leads. If your call-to-action is to download a free guide or eBook, you’ll be looking at 25-75 leads that can be added to your lead nurture pipeline.
With so many different digital marketing metrics available across numerous different channels and platforms, it’s easy to overlook some of the most important KPIs that deliver real value. By focusing on and regularly monitoring the metrics used to drive decisions, Fintech companies will be in a stronger position to maximise results from their digital marketing and ensure they are investing in the right activity.
